
| EOS Volcanology Plume Topography Studies |
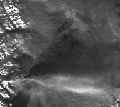
 Eruption Plumes (32K image)
Based on a photoclinometric model by L. Wilson, L. Glaze has developed an
algorithm designed to derive plume top topography and height from MODIS
(and/or AVHRR) images. The program, written in IDL, has been tested on
several datasets. This AVHRR subscene shows Mount Redoubt (Alaska) in
eruption on 18 December 1989. The vent is in the lower left corner of
the image and the plume (white in this visible channel) is being blown
to the east. The image is approximately 200 km across.
 Plume Top Topography (262 K image)
This is a 3-D surface plot of the Mount Redoubt eruption plume shown
above. The surface topography was derived from the visible AVHRR
image using the photoclinometry approach. All axes units are in
pixels; each pixel ~1.1 km across. A full discussion of the photoclinometry
model and an analysis of these data are included in Glaze, L.S., L. Wilson,
and P.J. Mouginis-Mark, "Volcanic eruption plume top topography and heights
as determined from phooclinometric analysis of satellite data", J.
Geophys. Res., 104, 2989-3001, 1999.
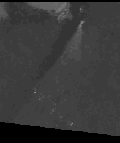
 Popocatepetl Plume (45K image)
This is another AVHRR subscene showing a plume from the 10 March 1996
eruption of Popocatepetl, Mexico. The volcano is located near the
top of the image and the fan shaped plume (light gray in this visible
channel) is being blown to the south. This image was acquired around
7:00 in the morning (local time), so there is a very long shadow
cast by the plume to the west.
 Popo Plume Top Topography (256K image)
This is a preliminary 3-D surface plot of the Popocatepetl plume shown
above. Again, the surface topography was derived using the photoclinometry
algorithm. The display shown here has been rotated counterclockwise by
about 30 degrees (in relation to the AVHRR image). All axes units are
in pixels (analysis of pixel scale is not yet completed). The gentle slope
rising to the western edge of the plume corresponds to the shadow area on
the image. In this area, the algorithm is calculating the altitude of the
plume above the ground, based on the elevation of the sun in the sky. Sharp
peaks along the eastern edge of the plume beyond 60 pixels E-W (above 5 pixels
elevation) are processing artifacts and should be ignored. We are currently
working on refining the analysis for this plume. This analysis was conducted
by Matt Peitersen.
 Steam Plumes (222K image)
Many aspects of the way that eruption plumes grow and are dispersed into
the atmosphere are poorly known. Before the plume top topography algorithm
was functional, Lionel Wilson, Lori Glaze and Steve Baloga spent time studying
smoke-stack plumes and other man-made phenomena to develop better algorithms
that describe the phenomenon. Super-heated steam plumes, such as the ones
seen here in southwest Iceland, form one such set of plumes that is useful
for this type of analysis. Photo by Pete Mouginis-Mark.
 Temperature Map of a Steam Plume (50K image)
This is a time-averaged map of the radiant temperature of an industrial steam
plume. The minimum and maximum temperatures are accurate (relative to the
assumed atmospheric temperature) to within a degree. Due to the process of
averaging the video data, it is not possible to definitively assign
temperatures to specific brightness levels. However, these temperatures can be
used to give a general idea of the range of temperatures within the plume.
Image provided by Lori Glaze.
 Return to Main EOS Volcanology Page